|
|
MD & A |
|
MD &
A |
|
MD & A Two |
Management's Analysis of Consolidated Operations (continued) RESULTS OF OPERATIONS Consolidated
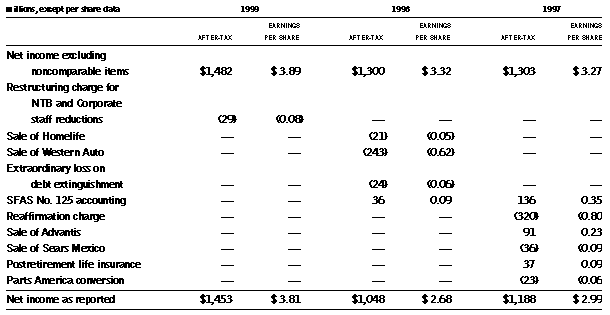
Description of
Noncomparable Items On November 18, 1998, the Company entered into an agreement to sell its Homelife furniture business for $100 million in cash, a $10 million note receivable and a 19% ownership interest in the new Homelife business. The Company recorded a loss of $33 million ($21 million after-tax) in the fourth quarter of 1998 related to this transaction. The sale was completed on January 30, 1999. On November 2, 1998, the Company completed an Agreement and Plan of Merger of Western Auto, a wholly owned subsidiary, and Advance Auto Parts whereby Sears exchanged its interest in Western Auto for $175 million in cash and approximately 40% equity ownership interest in the resulting combined company. Based upon the terms of the sale, the Company recorded a pretax loss of $319 million ($243 million after-tax) in 1998. On October 2, 1998, the Company prepaid debt with a face value of $300 million, which was due in May 2000. The transaction generated an extraordinary loss of $37 million ($24 million after-tax). The loss resulted primarily from the write-off of the related unamortized discount. In 1997, the Company implemented Statement of Financial Accounting Standards ("SFAS") No. 125, which changed the way the Company accounted for securitizations. SFAS No. 125 accounting provided incremental operating income of $58 million in 1998 and $222 million in 1997 ($36 million and $136 million, respectively, after-tax). The 1997 reaffirmation charge of $475 million ($320 million after-tax) represents the cost of the settlement of lawsuits and investigations which alleged that the Company had violated the United States Bankruptcy Code and consumer protection laws in various states through activities related to certain debt reaffirmation agreements and other related matters. There are no further open matters with respect to the reaffirmation charge taken in 1997. In 1997, the Company sold to IBM its 30% equity interest in Advantis, a joint venture between IBM and the Company. The sale resulted in a pretax gain of $150 million ($91 million after-tax) recorded in other income. In 1997, the Company sold 60% of the outstanding shares of Sears Mexico to Grupo Carso S.A. de C.V. The sale was recorded in the first quarter of 1997 and resulted in a pretax loss of $21 million reflected in other income and tax expense of $15 million, for an after-tax loss of $36 million. The Company changed its postretirement life insurance benefit plan in 1997 by eliminating retiree life insurance benefits for all active associates not retired by December 31, 1997. This plan change resulted in a one-time pretax curtailment gain of $61 million ($37 million after-tax) recorded as a reduction of selling and administrative expense. The majority of the Western Auto stores were converted to the Parts America format in 1997 and, as a result, the Company recorded a pretax charge of $38 million ($23 million after-tax) for this initiative. Analysis of
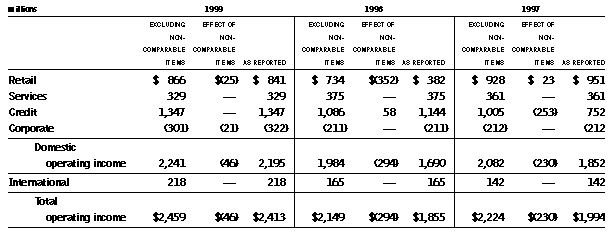
Consolidated Results Excluding Noncomparable Items In 1998, net income excluding noncomparable items was $1.30 billion or $3.32 per share, an increase of 1.5% over comparable 1997 per share earnings of $3.27. The improved profitability of the Credit and Services segments, coupled with strong International performance, a reduction of shares outstanding, and a lower effective tax rate was largely offset by a decline in Retail results. Reportable Segments
Retail
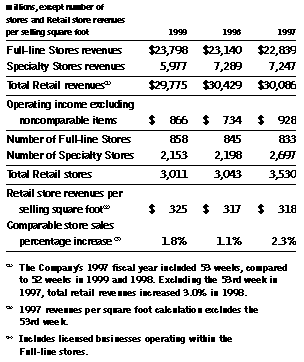
Retail revenues decreased 2.1% in 1999 to $29.78 billion from $30.43 billion in 1998. Excluding the exited businesses, Western Auto and Homelife, retail revenues increased 3.2% in 1999. Revenues in 1999 and 1998 included 52 weeks compared to 53 weeks in 1997. Full-line Stores revenues increased 2.8% in 1999, benefiting from the net addition of 13 Full-line Stores as 19 stores were opened and 6 were closed. The Full-line Stores increase was led by solid revenue performance in hardlines merchandise as comparable store sales increased in 1999. Hardlines revenue increases in home appliances, electronics and home improvement were partially offset by a decline in home office merchandise sales. Apparel sales were strong in women's special sizes, infant's and toddler's, fine jewelry, home fashions, and cosmetics and fragrances but were offset by results in dresses, footwear, junior's, boy's, girl's and men's apparel. Specialty Store revenues decreased to $5.98 billion in 1999 from $7.29 billion in 1998 due primarily to the sale of Western Auto and Homelife. Excluding the exited businesses, specialty retail revenues increased 4.7% in 1999. The strong revenue performance in Hardware and Dealer Stores was partially offset by a decline in Auto Stores revenues. The revenue increase in Hardware and Dealer Stores in 1999 resulted from the addition of new stores and strong comparable store sales increases. During 1999, the Company opened two net new Hardware Stores and 85 net new Dealer Stores. The Contract Sales business and The Great Indoors also produced revenue gains as the Company continued to expand these businesses. The Auto Stores 1999 revenues were below management's expectations and declined from 1998 levels. Comparable store sales decreased and the Company closed 33 NTB stores in the third quarter of 1999. As of year-end, the Company operated 798 Sears Auto Centers and 310 NTB stores. Retail revenues increased 1.1% in 1998 to $30.43 billion from $30.09 billion in 1997. 1998 included 52 weeks of revenue compared to 53 weeks in 1997. Full-line Stores revenues increased 1.3% in 1998 as the Company added 12 net new Full-line Stores. In 1998, apparel sales gains were led by increases in women's special sizes, fine jewelry and cosmetics and fragrances, partially offset by weak sales of dresses, juniors, boy's and men's apparel. Hardlines merchandise had a solid revenue increase in 1998 led by strong sales growth in home appliances and electronics merchandise, partially offset by a decline in home improvement and home office merchandise sales. Specialty Store revenues increased slightly to $7.29 billion in 1998 from $7.25 billion in 1997 as strong performance in Hardware and Dealer stores was offset by a decline in Auto Stores revenue. Auto Stores revenues declined in 1998 from 1997 as comparable store sales decreased from prior year levels, Western Auto had only 10 months of sales in 1998, and sales were affected by the relatively mild winter weather. In addition to revenue performance, gross margin, selling and administrative expenses, and depreciation and amortization are important elements in determining Retail operating income. The following discussion of Retail gross margin, selling and administrative expense, and depreciation and amortization excludes the effect of noncomparable items to provide a more meaningful comparison between years. The noncomparable items that affected the Retail segment operating income were the restructuring costs related to the closing of 33 NTB stores in 1999, the losses related to the sales of Western Auto and Homelife in 1998, and the Parts America conversion and the postretirement life insurance curtailment in 1997. Retail gross margin as a percentage of Retail revenues was flat in 1999 compared to 1998. While the first three quarters of 1999 reflected unfavorable gross margin rates compared to 1998, in the fourth quarter, gross margin rates rebounded in both hardlines and apparel, lifting the retail gross margin rate for the full year to a level consistent with 1998. In 1998, Retail gross margin as a percentage of Retail revenues declined 90 basis points from 1997. In 1998, the decline was due to higher promotional activity driven by a competitive retail environment. Retail selling and administrative expense as a percentage of Retail revenues improved 50 basis points in 1999 from 1998. The improvement was primarily driven by lower marketing expenses and improvements related to the exit of the Western Auto and Homelife businesses which had higher cost structures. In 1998, Retail selling and administrative expense as a percentage of Retail revenues improved 40 basis points from 1997. In 1998, the improvement was primarily due to leveraging payroll and other employee-related costs. Retail depreciation and amortization expense decreased 1.8% in 1999 from 1998 and increased 5.0% in 1998 compared to 1997. The slight decrease in 1999 reflects the absence of depreciation and amortization from the exited businesses of Homelife and Western Auto. The increase in 1998 reflects the continuation of the Company's store remodeling program and the growth in the number of Specialty Stores in operation. Services
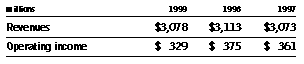
Services revenues, generated primarily by the Home Services business, declined 1.1% in 1999. Home Services revenues were down 1.6% due primarily to a decline in the home improvement business. Direct Response revenues increased 1.9% in 1999 from 1998 as the clubs and services business improved while insurance and other merchandise revenues were relatively flat. In 1998, Services revenues increased 1.3% primarily due to an 8.5% increase in revenues from Direct Response. All categories of Direct Response products showed improved revenue results in 1998, including clubs and services, insurance and specialty catalogs. In 1998 Home Services revenues were flat as an increase in installation services was offset by a slight decline in the home improvement business and the 53rd week included in 1997. Services gross margin as a percentage of Services revenues increased 20 basis points in 1999 from 1998. While gross margin rates were relatively flat in both the Home Services and Direct Response businesses, a shift in revenue towards the higher margin Direct Response business caused the overall margin rate to increase. In addition, included in the improved gross margin are the costs related to the exit of a Home Services licensed business relationship which adversely affected the Services gross margin rate by 65 basis points. In 1998, Services gross margin as a percentage of revenues improved 100 basis points from 1997, primarily due to improved profitability of the service contracts portfolio within the Home Services business. Services selling and administrative expense as a percentage of Services revenues increased 130 basis points in 1999 from 1998. The increase was primarily due to higher payroll, insurance and marketing costs. In 1998, Services selling and administrative expense as a percentage of Services revenues increased 50 basis points from 1997 due to increased infrastructure investments. Services depreciation and amortization expense increased 16.3% in 1999 from 1998 and 16.7% in 1998 compared to 1997. These increases reflect both infrastructure investments and recent acquisitions. Overall, while operating income for both Home Services and Direct Response decreased in 1999, the majority of the decrease came from the home improvement division of the Home Services business. Direct Response continued to provide a significant portion of the operating income for the Services segment in 1999. |
|
Annual Report 1999 |
|